Wall Street's summer calm is colliding with the year's most volatile stretch: Chart of the Day
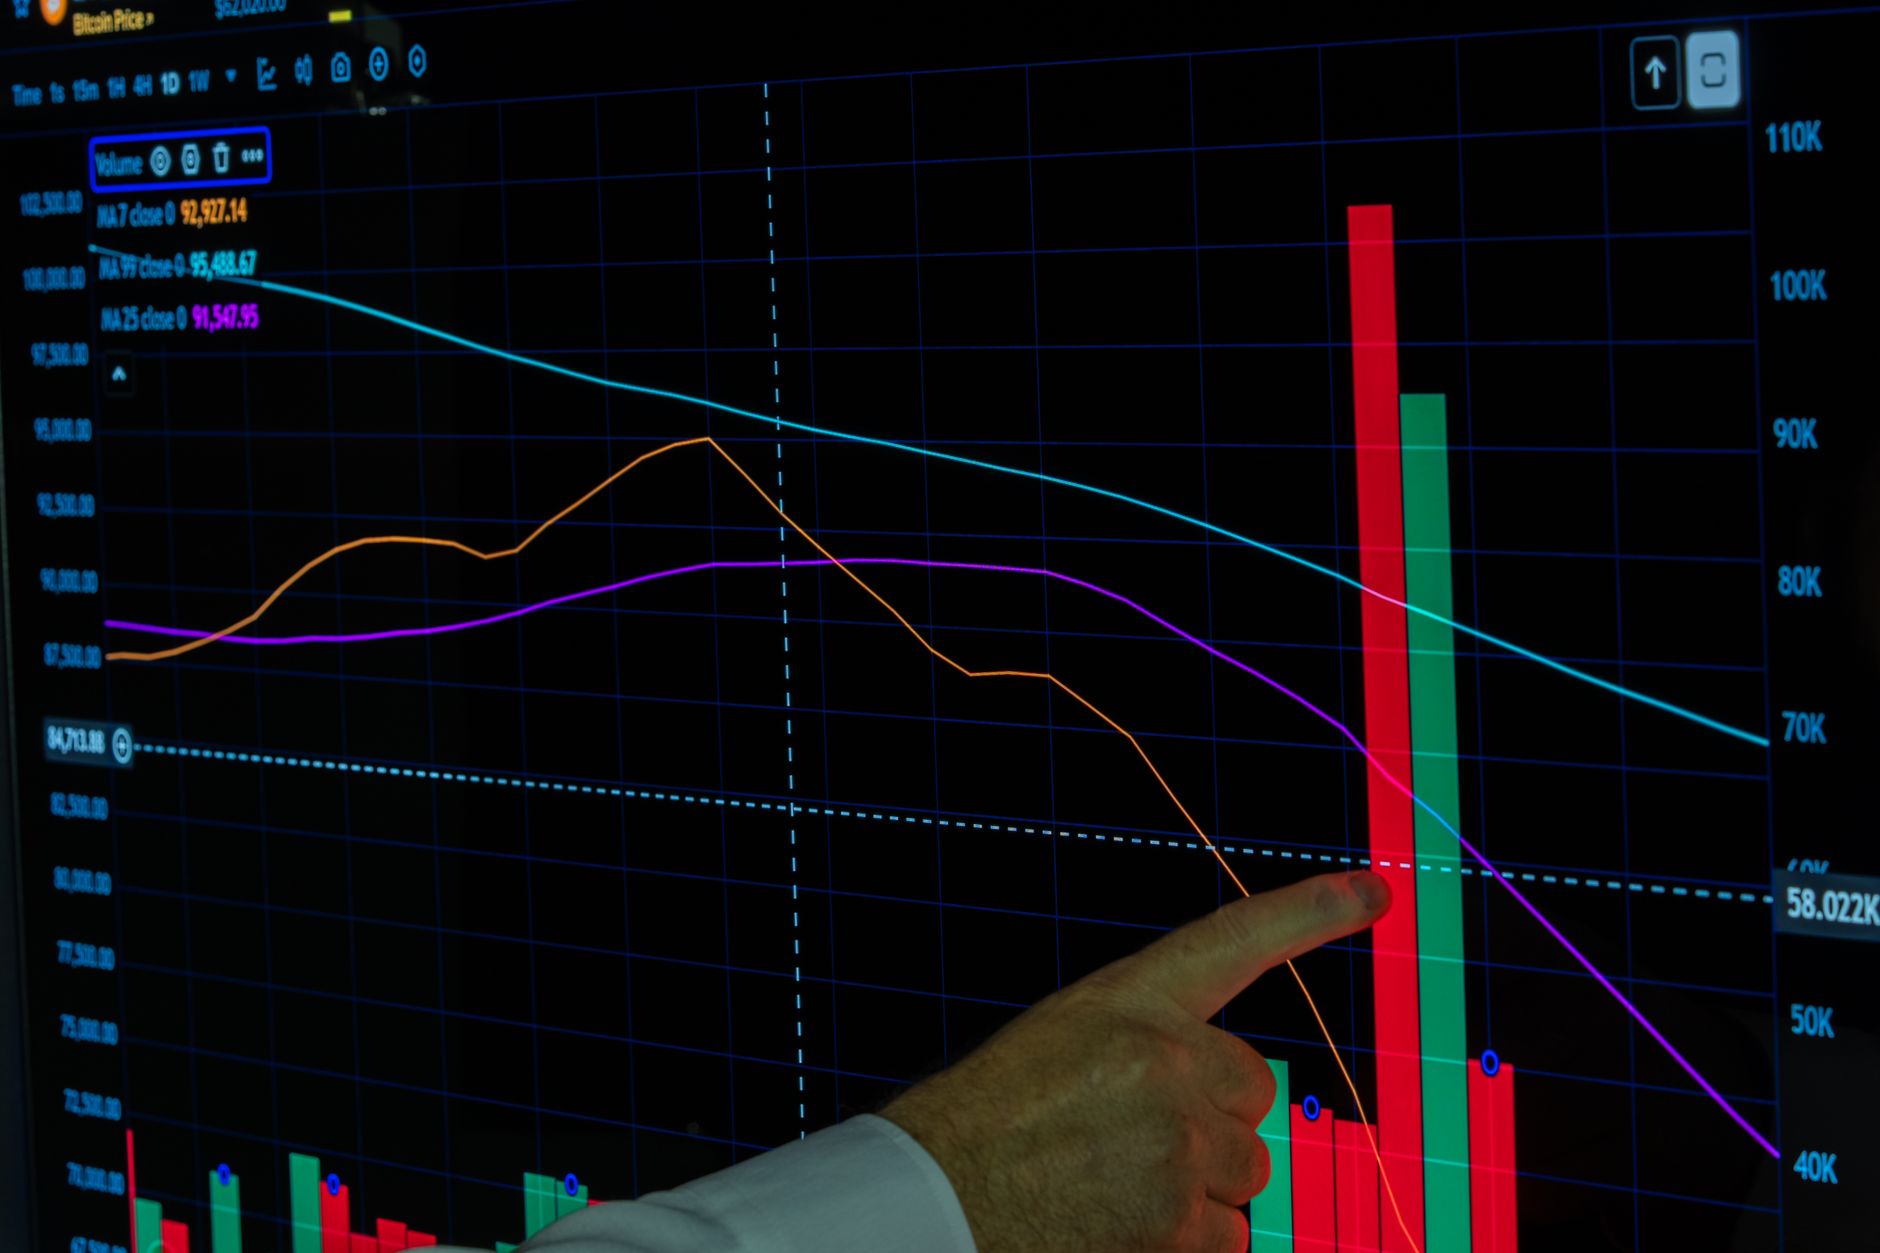
The CBOE Volatility Index dropped to 14.13 on Friday, marking the lowest level of 2026. This quietness, after a summer of subdued swings, is expected to give way as the calendar turns toward a historically more volatile period.
Key Takeaways
- The VIX fell to 14.13 on Friday, its lowest level of 2026.
- Historically, the VIX median in late August is about 16.5, rising toward 18 by mid‑September and roughly 19 in early October.
- September has been the weakest month for the S&P 500 since 1950, with an average decline of 0.6%.
- Midterm election years often see a weak September followed by stronger October and November.
- A rising VIX reflects higher expected volatility, not a guaranteed market decline.
| Metric | Value | Why it matters |
|---|---|---|
| VIX level Friday | 14.13 | Lowest in 2026, indicating calm market sentiment. |
| VIX median late August | 16.5 | Typical starting point for seasonal volatility rise. |
| S&P 500 September average decline | 0.6% | Historical weakness that often precedes a rebound. |
What the VIX Measures
The VIX is the CBOE Volatility Index, calculated from S&P 500 option prices. It represents the market’s expectation of 30‑day price swings, not the direction those swings will take. A higher VIX signals that traders are pricing in larger moves, while a lower VIX indicates a calmer outlook.
Current Calm: VIX at 14.13
Friday’s 14.13 reading is the lowest VIX level recorded in 2026. The drop follows a summer in which volatility has steadily declined after a brief spike in the spring tied to Iran‑war headlines. The calm suggests that, for now, investors are not anticipating large market swings.
Seasonal Trends: September and Beyond
Statistical analysis shows that the VIX median in late August sits around 16.5, climbs toward 18 by mid‑September, and reaches roughly 19 in early October. These numbers are averages since 1990 and illustrate a typical seasonal uptick. September, in particular, has historically been the weakest month for the S&P 500 since 1950, with an average decline of 0.6%. However, the period that follows often sees a rebound, especially in October and November.
Midterm Elections and Market Volatility
During midterm election years, the pattern of a weak September followed by stronger October and November tends to be more pronounced. Stocks have often struggled from late summer into early fall in these years, only to recover later in the season. This seasonal behavior is a tendency built from many different market conditions and does not guarantee a specific outcome for 2026.
Interpreting Volatility: Direction vs. Movement
A rising VIX does not automatically mean the market will fall. It merely indicates that options traders expect larger price swings. Stocks can rally even with elevated volatility, and they can decline even when volatility is subdued. The key takeaway is that the range of possible outcomes widens as the VIX climbs.
Why it Matters
Understanding the VIX and its seasonal patterns helps investors gauge market sentiment and potential risk. Knowing that September historically weakens the S&P 500 while October and November often recover can inform portfolio timing decisions. Additionally, recognizing that a higher VIX reflects broader uncertainty rather than a guaranteed downturn allows investors to avoid knee‑jerk reactions to market noise.
For more context, see the Yahoo Finance article by Jared Blikre.
Frequently Asked Questions
What is the VIX?
The VIX is the CBOE Volatility Index, derived from S&P 500 option prices, and measures the market’s expectation of 30‑day price volatility.
Why did the VIX drop to 14.13?
The drop reflects a period of subdued market activity after a brief spring spike tied to Iran‑war headlines. It indicates that traders are pricing in less volatility for the next month.
What does a low VIX mean for stocks?
A low VIX signals calm market sentiment but does not guarantee that stock prices will rise. It simply means that options traders expect smaller price swings.
How does seasonality affect the S&P 500?
Historically, September has been the weakest month for the S&P 500, with an average decline of 0.6%. After this dip, October and November often show stronger performance, especially in midterm election years.
What should investors watch in September?
Investors should monitor the VIX for signs of rising volatility and be prepared for a potential dip in the S&P 500. However, they should also keep an eye on broader economic data and election developments that could influence market direction.
Bottom Line
The VIX’s fall to 14.13 signals a brief period of calm, but seasonal patterns suggest that volatility will likely rise again in September and October. While a higher VIX indicates increased risk, it does not dictate market direction. Investors should stay alert to both the VIX trend and broader economic indicators to navigate the upcoming months effectively.
This is educational information, not personalized financial advice.
Reporting based on: original source.